Every company that is setting targets, must measure performance from time to time to evaluate whether they are on track or not. Financial budget measures whether company is on track on its financial targets. Every budget is a model of expected performance results based on sales prognosis (Revenue), cost of goods sold (COGS) and of different operating cost accounts like employee expenses, office expenses, marketing expenses, R&D expenses etc.
In short, a budget provides:
- Financial plan for executing operational strategy
- Guideline for line managers to plan activities
- Return on Investment calculations
- Triggers for deviations
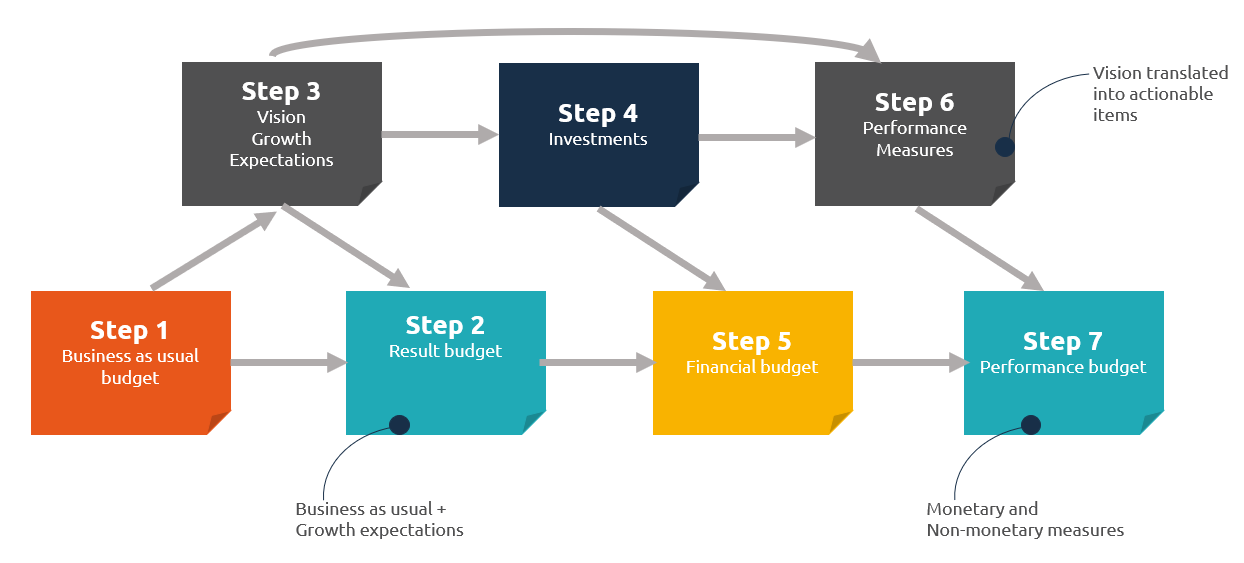
Budget creation
Budget creation usually starts with rolling prediction created by line managers. We can call this a business-as-usual budget.
Around third quarter top management and partners take some time to clarify long-term targets. They evaluate market opportunities for different segments and predict growth opportunities. This step provides inputs to update sales predictions and calculate necessary investments.
For organization to achieve those updated targets performance measures must be updated as well. Performance measures are operational indicators that show as early as possible how organization is doing in moving towards their targets. Those operational targets or Key Performance Indicators, if you will, usually are:
- How many sales calls a sales person has to make to keep pipeline healthy,
- Home many deals there has to be in a pipeline to have expected sales?
- What should be our customer satisfaction level be?
- What should be a resolution time for a support case? etc.
After financial budget has been compiled from inputs of investments and updated result expectations, a Performance Budget can be compiled that combines financial inputs and performance measures to a single dashboard for line managers so that relationship between performance and results could be evaluated at any time.
From there on organizations smoothly move over to a rolling budget. Some have a very strict policy to update budget/prediction every quarter. Usually the first update is done in June starting from Q3.
The reason for this midsummer approach is that to start updating budget already from the second quarter means that updates have to come in already in March, the end of Q1. But this is usually too short a period to have any kind of real feeling of how are things actually progressing.
On average organization have one budget review in June/July and other in October. October is a good time to understand how things are going after summer vacations and sales has more or less valid pipeline for Q4.
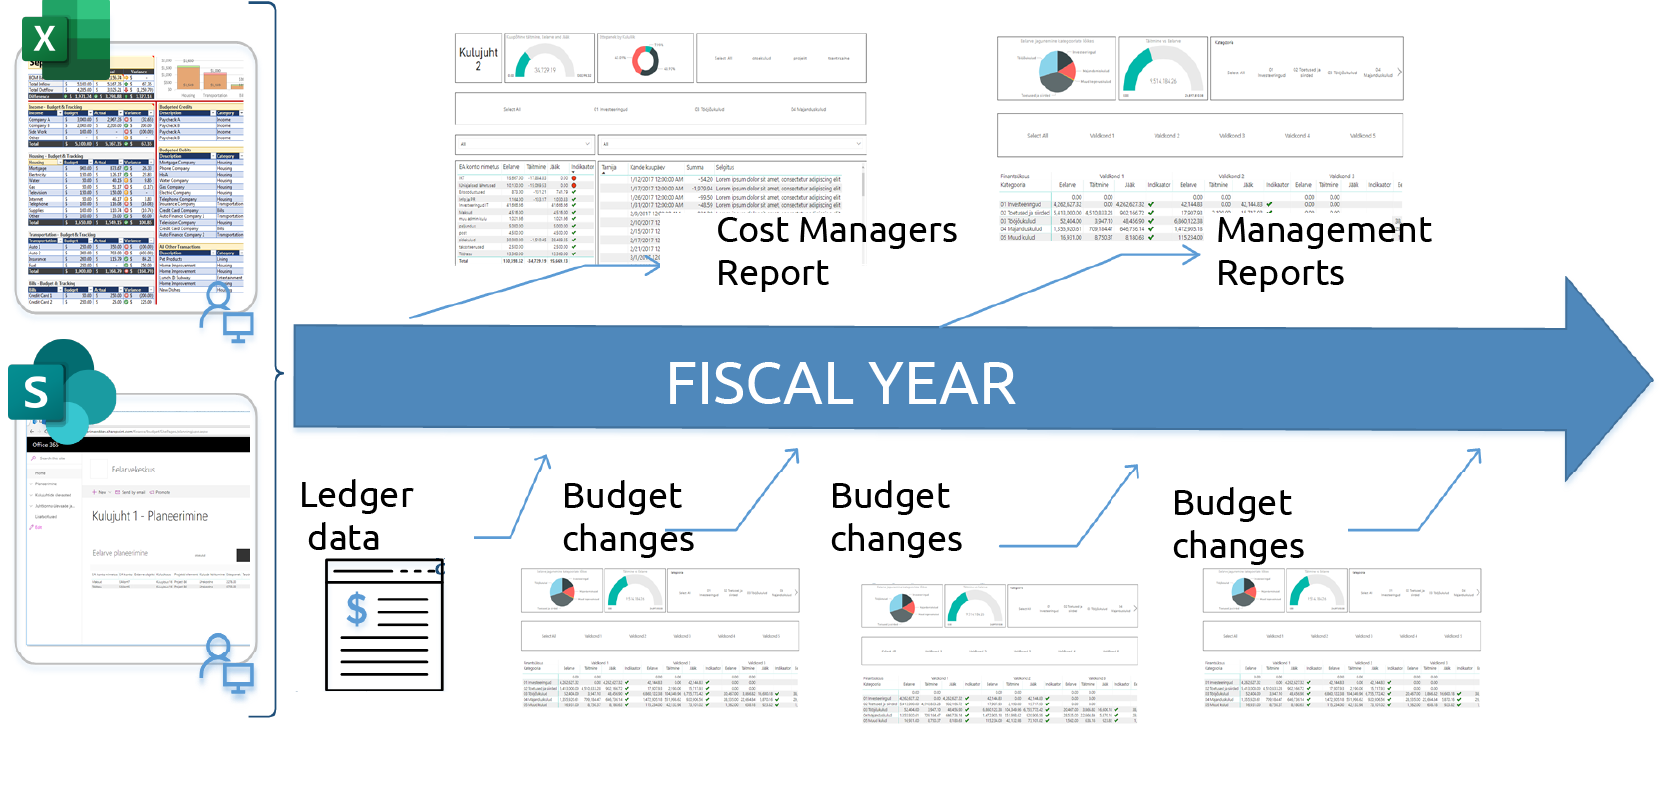
In mature organizations this kind of budgeting process is a standard and Primend has found a perfect fit to support this kind of budgeting process with standard tools of Office 365 and Power BI.
Keep it Simple with SharePoint, Excel and Power BI
Some organizations are using a specialized budgeting tool. This tool is usually quite expensive and introduces new interfaces that people have to learn. We have found that Microsoft Office 365 SharePoint, Office 365 Excel and Power Platform provide all necessary functionality in an accustomed interface that is easy to use and secure to manage.
Microsoft 365 SharePoint and Excel provide:
- Environment to jointly edit budget tables
- All budget model calculations can be included in Excel
- Different departments can keep their budget in separate files
- SharePoint provides convenient folder structure for budget and for forecasts
- SharePoint has integrated Microsoft 365 security features like version management, controlling access, alerting on changes etc.
- Power BI keeps current year, last year, budget and comparison data up to date
- Power BI provides visually pleasing KPI indicators and charts that improve communication
- Role Based Security can be used to allow access to only part of report data
- Approval workflows and data entry form can be created with Power Platform tools
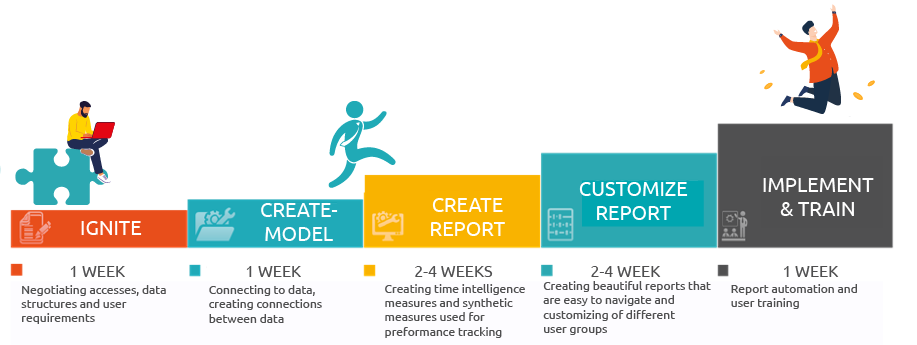
Implementation is Quick and Straightforward
Implementation is usually straightforward as people do not have learn new tools and can be productive from day one. The most time consuming parts of the project are usually standardization of budgeting process and agreeing on visuals that convey information the best.